Reports
Use the Reports tab to get a quick overview of your venue's performance in terms of bookings, revenue, and player activity over the selected period.
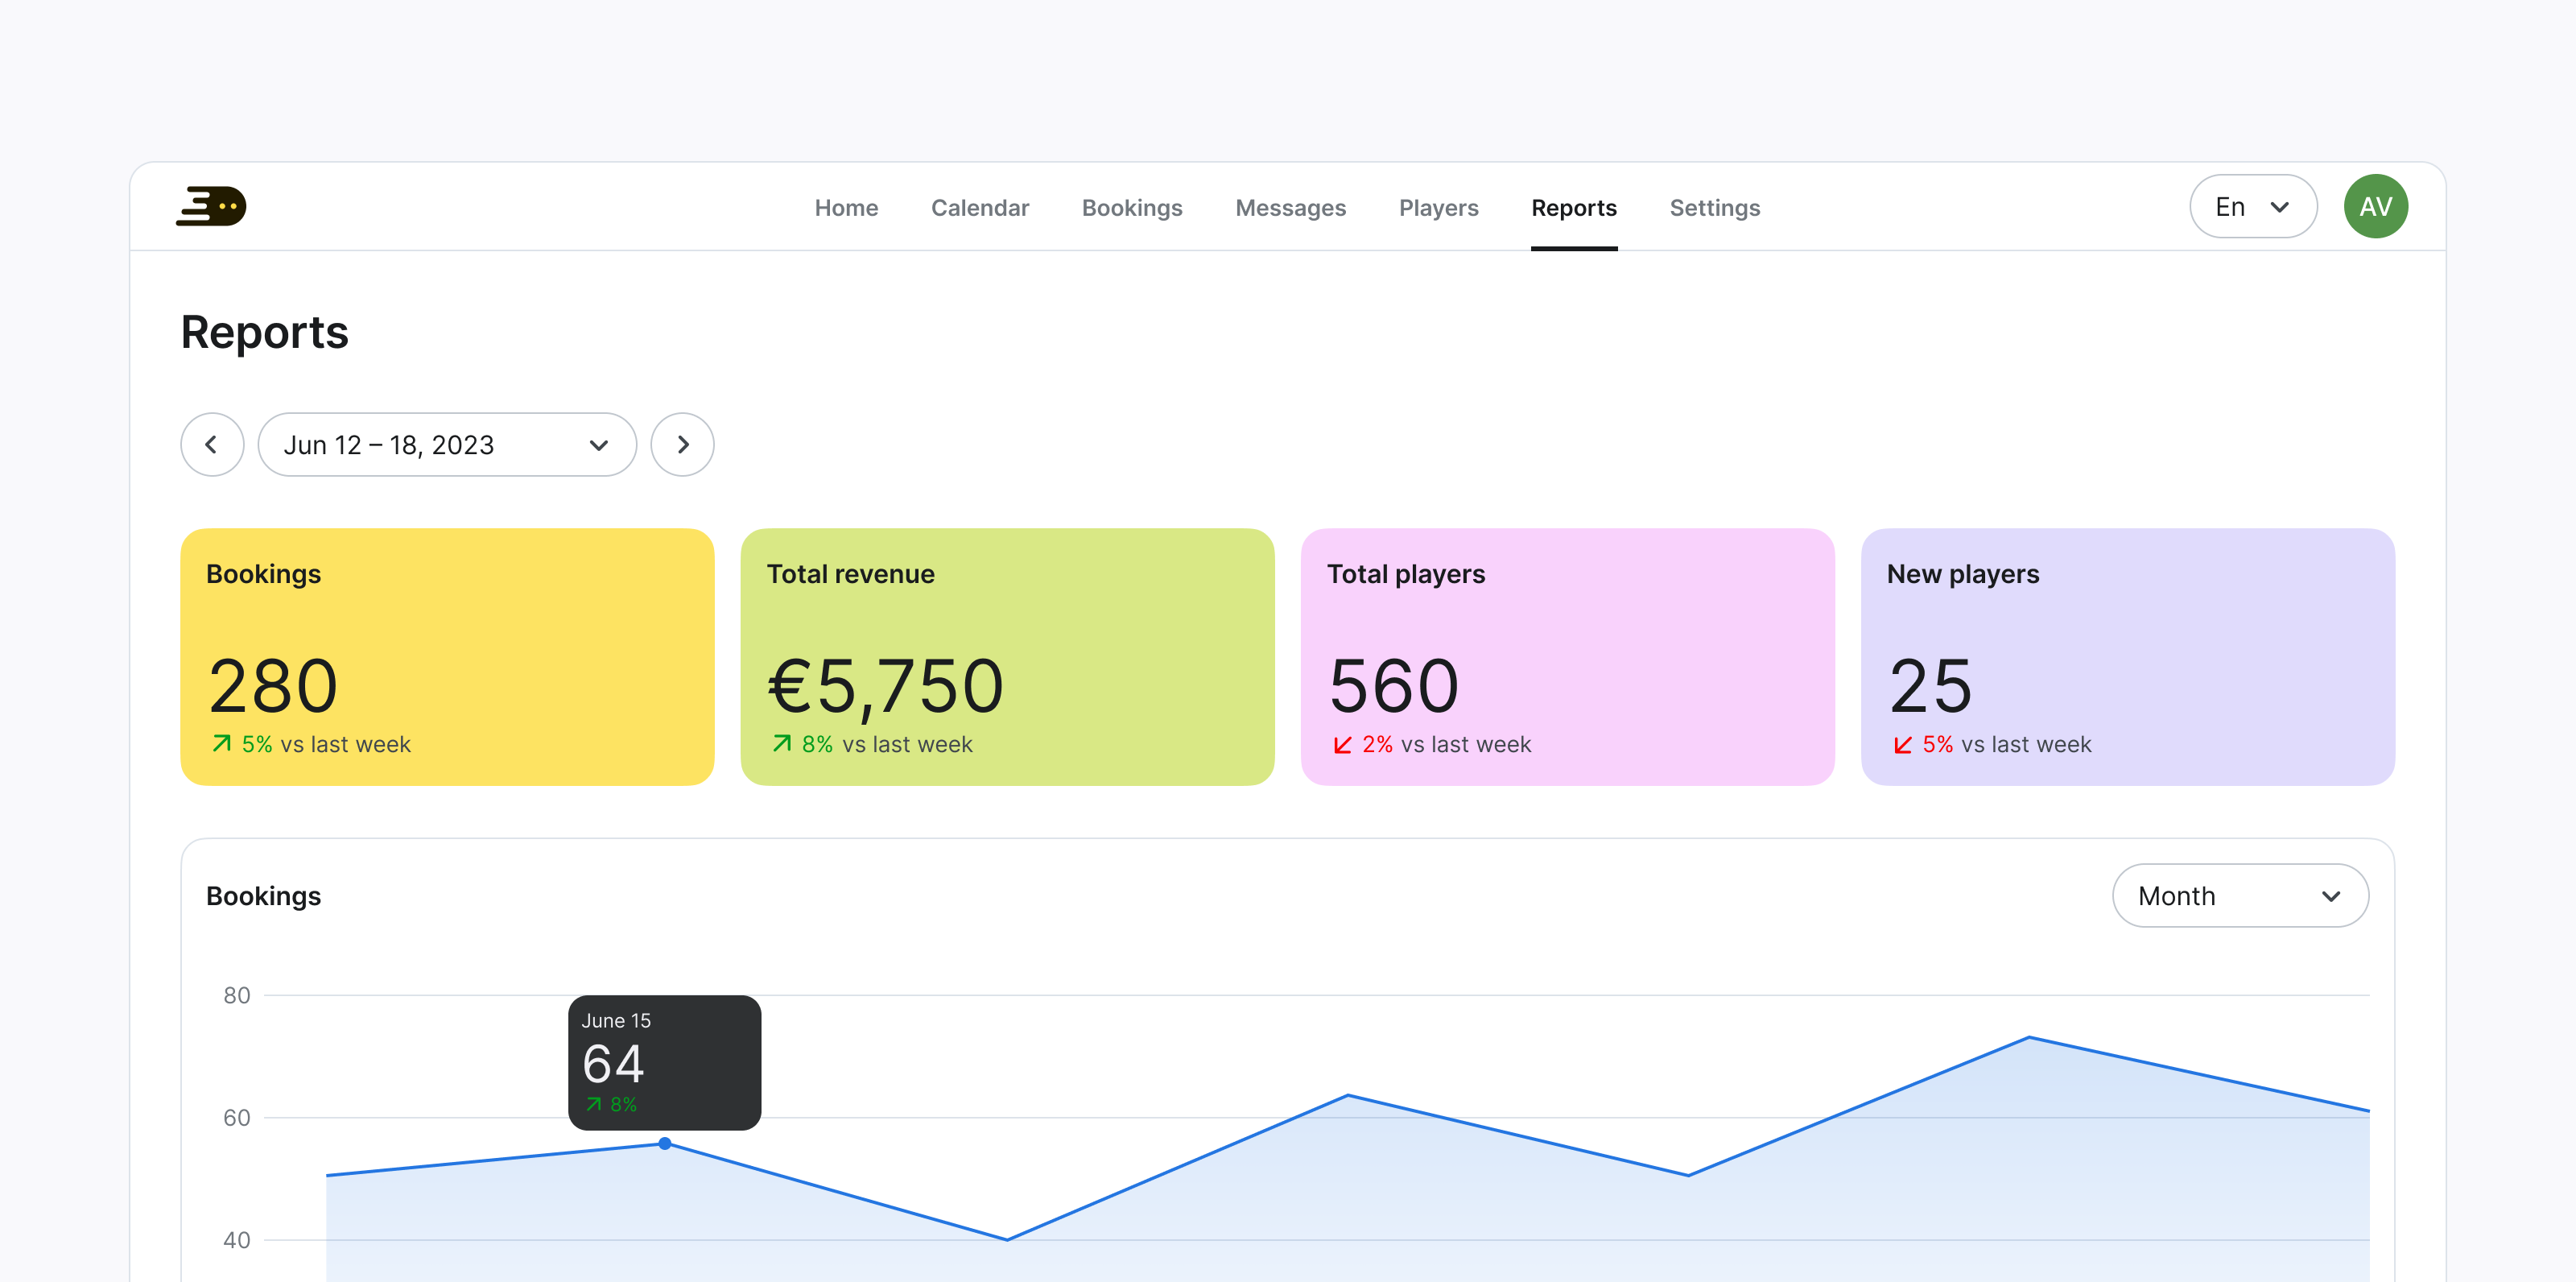
The data on this screen is displayed weekly and compared to the previous week. Navigate to the desired week using the date picker.
Summary Cards
- Bookings: Displays the total number of bookings for the selected week, along with the percentage change compared to the previous week.
- Total Revenue: Shows the total revenue generated during the selected week, including the percentage change from the previous week.
- Total Players: Indicates the total number of players who made bookings for the selected week, with the percentage change from the previous week.
- New Players: Displays the number of new players who made bookings during the selected week, along with the percentage change from the previous week.
Bookings Chart
- Visualizes the number of bookings per day within the selected week.
- Hover over the chart to see the exact number of bookings for each day.